Stock Technical Analysis In Australia is the most used method of analysis by stock market traders. It is based on the study of historical prices and makes it possible to predict the evolution of the price of an asset.
Graphical analysis is not an exact science; it is based on the study of probabilities. It gives buy and sell signals which can be used by the technical analyst for investing or speculating. For each of your trades, you can get a precise position entry and exit point.
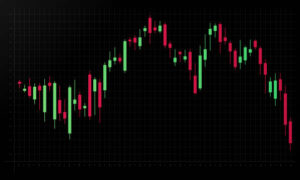
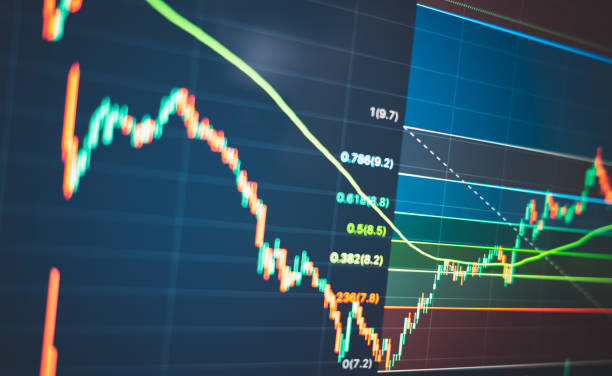
Technical analysis includes several elements: chart patterns, Japanese candlesticks, technical indicators and graphical representations.
All these elements make it possible to analyze the trend, to identify consolidation or reversal phases, to identify troughs or peaks or even to anticipate rebounds or corrections.
Unlike the fundamental approach, technical analysis is an analysis tool accessible to everyone. Learning to analyze a price chart is much easier than analyzing economic data.
If you are new to the stock market and want to trade, chart analysis is a valuable ally for making money.
Technical Indicators in The Stock Market
Technical indicators are mathematical formulas based on the study of prices and/or volumes allowing to take advantage of a market situation. They make it possible to visualize graphically the evolution of the speed and the quality of a movement over a given period.
Stock market indicators make it possible to predict the future evolution of prices. They are valuable decision-making tools when you know how to use them. It is important to fully understand how they work in order to then be able to optimize the settings and make the indicator efficient.
There is no miracle stock market indicator but only technical indicators that we use well or badly. Each has its qualities and its defects.
Some indicators are better in a directional market while others will be to identify reversals. There are different types of technical indicators in the stock market:
Technical Analysis and Fundamental Analysis
The basic principles of technical analysis are based on the study of stock prices and are often used in addition to fundamental analysis.
Indeed, to predict future trends in stocks or currency pairs on the foreign exchange market, traders use technical analysis and/or fundamental analysis.
Although the objective of the two analyzes is the same, they are based on different bases.
While fundamental analysis focuses on the real value of an asset, taking into consideration the content of external factors and the intrinsic value of a company, technical analysis is based on the graphical study of this same asset.
Indeed, fundamental analysis consists in analyzing the characteristics of a company in order to estimate its value.
Technical Analysis Takes a Totally Different Approach; It Doesn’t Care About The “Value” Of A Business.
Technical analysis is only interested in the evolution of prices on the market, it is based on the following 3 basic principles: – All known information relating to the title is reflected in the price of the action, including including the fundamentals.
– As soon as new information comes to light, it immediately affects the share price.
– Prices move according to trends These two approaches are complementary, even if some traders make a difference.
Indeed, a large part of traders consider themselves to be technicians and devote themselves only to the study of trends and do not take into consideration the economic news of companies or the economy in general.
The only thing that makes sense to them is the stock or financial asset price, other data is of no use.
Entry signals are based on price formation and signals from technical indicators.
Generally, for traders, this method is considered more reliable than fundamental analysis, this is not a rule in itself.
In Fact, The Main Advantage of Technical Analysis Is Its Simplicity.
Know that it is quite possible to master technical tools and charts while having no knowledge of the stock markets.
Conversely, another category of investor does not consider themselves technicians, but rather focuses on understanding and analyzing macro and micro economic data.
These traders have the activity of monitoring the publications of macroeconomic data, they devote themselves to studying the stock market news and deciphering the data of the day.
For example, they study the reports that each country regularly publishes revealing the health of its economy.
The data with the strongest impact on stock prices and currency rates are those relating to employment, GDP or inflation.
Statements from central banks are also closely watched as they can bring a lot of volatility to the stock market.
In Fundamental Analysis, We Buy or Sell When an Asset Becomes Undervalued or Overvalued.
Traders who use technical analysis are made up of short-term traders and spend trades over a day, several hours, several minutes or even a few seconds.
The other group of investors is rather made up of people who trade for months, weeks, or days.
Technical analysis is not better than fundamental analysis and the reverse is also true, these two methods are rather complementary.
However, given its rules of thumb and often considered subjective, technical analysis is rarely used by fundamental analysis purists.
Indeed, investors who operate on the financial markets after having dissected the balance sheet of a company rather base their investment strategies on macro indicators (sector analysis, etc.
Technical Indicators from Technical Analysis for Trading On the Stock Market
Technical indicators are defined in several categories: Trend indicators, Momentum indicators, Volume indicators, Oscillator indicators, Volatility indicators.
In the list below you will find the list of the most popular indicators, and learn the basic concepts of technical analysis which aims to introduce you to the strengths and weaknesses and to familiarize you with the terms and concepts. basic technical analysis.
In order to know a little more about technical analysis and help you in your operations or your investments, we invite you to consult the articles below.
Read More: Options Trading Course.