Empathy Maps are a useful team exercise that allows you to visualize and organize qualitative user research. They can be used at the beginning of a design process, or as a way to align the team on their users.
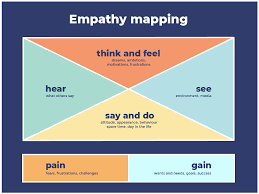
Start by gathering your research, ideally using a cloud-based tool that supports real-time collaboration. Then use the four basic sections of Say, Think, Do, Feel (plus Pains and Gains) to create an empathy map.
What is Empathy Mapping?
An empathy map is a visual way to consolidate and organize qualitative research findings about your target user(s) for product design. You can use it to communicate your research results to stakeholders in a clear and concise manner. Aggregated empathy maps can also act as a reference point to fact check user assumptions throughout the product development process.
Using an Empathy Map template (such as this one from Stormboard), sketch your target user in the center of the page and label the four essential quadrants: Says, Does, Feels and Sees. Then, ask your team to record what they know about that person or their needs and pain points using sticky notes.
Be sure to clarify any observations that may be a speculation or assumption and validate them with the appropriate source (such as a user interview or contextual inquiry). When you’re done, review your findings for consistency and clarity. Then, identify areas where you can add value to your users and create a plan for doing so.
Why Use Empathy Mapping?
Empathy maps help us understand our users, which in turn helps guide design decisions. As long as the data gathered to create the empathy map is based on real observations (not just conjecture) and the results are validated, they should be an effective tool.
The first part of the empathy map, ‘Says’ focuses on what your user says about the product and their experiences with it. This information can be gathered through interviews, surveys or direct feedback from customers after a usability test.
The second part, ‘Does’, covers the external activities your user engages in. This can be a good place to record specific examples of things that your user does with your product and how they go about doing those actions. Lastly, the third part, ‘Thinks and Feels,’ is a great place to capture the internal thoughts and feelings your user has. This can be a great way to identify the pain points that need to be addressed in your product.
How to Create an Empathy Map
While an empathy map is most effective when based on research data, it can also help synthesize existing knowledge of your target audience. Empathy maps are especially useful for early in the design process, when they can be used to build provisional personas or as a bridge between personas and concepting.
Start with the research you have collected, which should include qualitative data like user interviews, field studies, diary study results, or listening sessions. Have team members read through the data and write down observations on sticky notes that align to the four essential quadrants of an empathy map: Says, Does, Thinks, Feels.
Once everyone has filled out their sticky notes, review the results to identify patterns and insights. Then, discuss how the research you’ve collected could help your product. You can then draw conclusions and produce new diagrams, such as flowcharts and wireframes, in real-time with the online collaboration tool Gliffy. All of your diagrams are saved in the same project, so you can easily link them to other deliverables and documents.
Tools for Empathy Mapping
An empathy map combines data from different sources into one easy-to-read visual. It can be used at the beginning of a design process as part of an in-depth user persona study or it can be used later to help teams shift away from their preconceptions and toward a more customer-centric approach.
Typically, the first section of an empathy map will focus on what your customers say. This can include their ultimate goals with your product, the tasks they perform to achieve those goals, and the feelings they experience during these processes. This data should be gathered through interviews, contextual inquiry, and/or qualitative research.
The second section of an empathy map will focus on what they do. This can include the physical actions they take, their thoughts and emotions as they complete those tasks, and any obstacles they encounter. This data should be gathered through observations made during an interview, contextual inquiry, and/or qualitative research. With Gliffy’s collaborative features like comments, @mentions, live voting and in-product chat, you can ensure all of your team members are on the same page with the latest updates to a diagram.


